I loved the idea of Super Saturday pitched by Westfield to tenants at Westfield Knox City. We completed the form indicating we would offer 25% off all gifts except plush and Christmas. We did this to be an active participant in a whole of centre sale that they would promote through a catalogue and other mediums.
Whereas AMP, the former landlord, would share with us the marketing material well in advance, Westfield kept it to themselves until the morning of.
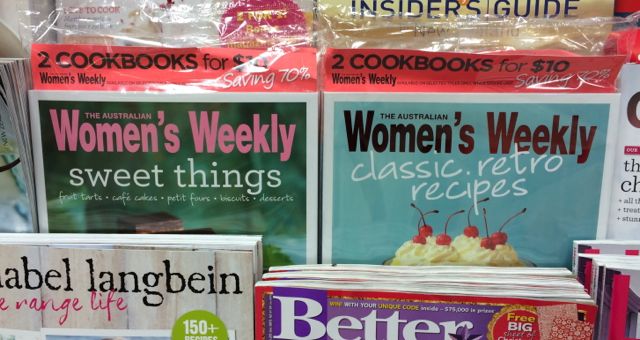
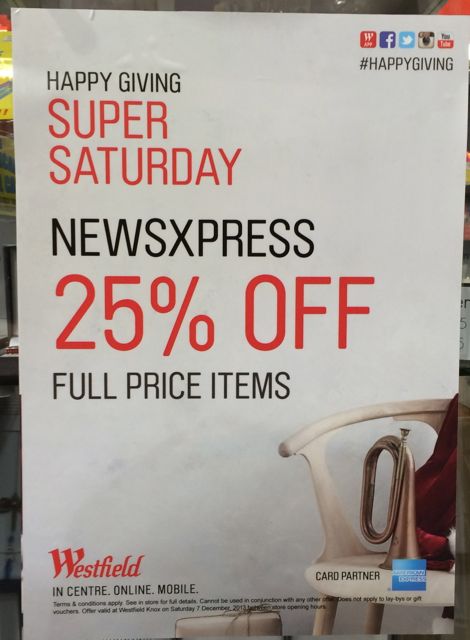
 Saturday morning we discovered Westfield didn’t follow our request, they were promoting us offering 25% off everything in-store – not just gifts as we indicated. The poster, catalogue and other materials were all wrong. Someone from centre management visited after we contacted them but he offered no solution or compensation for the mistake by Westfield.
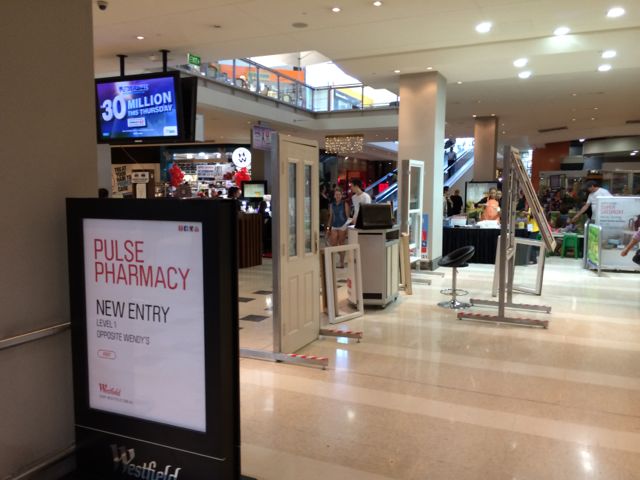
 Also on Saturday, Westfield setup a series of outposts and signs out the front of my shop in such a way that they blocked the usual and natural flow of foot traffic from the car park across to the newsagency. The photo does not show how bad the Westfield layout was. Not only did it block traffic, the door outpost was dangerous with people (myself included) tripping on the base of one of the stands. Again, the person from centre management offered no solution.
One outpost was a kids activity area. The centre management guy said it’s bringing people to centre. I doubt that. It was blocking access to my shop. I need access to make sales and pay the rent. That argument appeared to be lost on this guy.
I asked for the centre manager to contact me, they have not yet done this.
I was angry Saturday when I saw the marketing screw up and the traffic diversion because this was to be Super Saturday, the landlord had let us down and upon showing them this they offered no assistance. This same landlord takes a zero tolerance approach to stepping over the lease line and other matters yet they do not hold themselves to the same standard.
What I would have liked is a free spruiker at the shop to attract people walking past because of their barriers and someone pitching the actual offer we had and not the mistake on their posters and in their catalogue.
If they read this blog post they will most likely complain to me and step up ‘compliance’ visits to the store. It’s happened with landlords before. You screw up and they attack, you complain about their screw up and they attack. This is life in a shopping centre.
I decided to not blog about this Saturday or Sunday as I was too angry. The post I wrote in my head was full of venom. While am still angry this morning, the passing of time has dulled the anger somewhat.
Saturday was okay for us, not what we expected, but okay. It would have been much better had Westfield not screwed up.
Westfield needs to look carefully at what it does in its centres at busy times like Christmas. While they run feel good promotions, they often don’t result in shoppers visiting shops. They fill mall areas with outposts from short term tenants often not represented in the centre and who pull focus from their long term tenants who pay the bulk of the rent. They make mistakes on promotions and don’t fix them. They rarely work with you on programs that will work for your business.
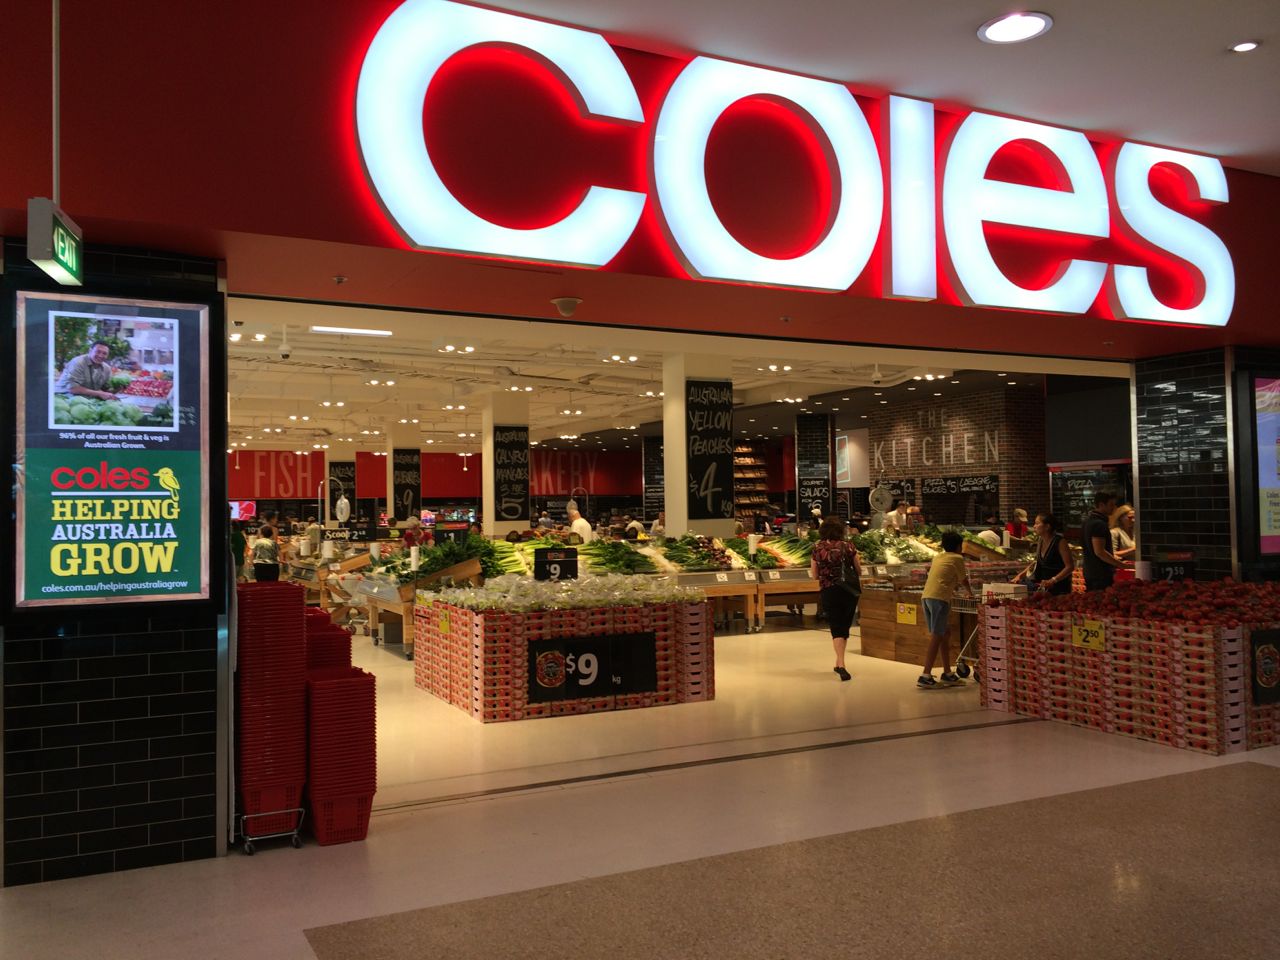
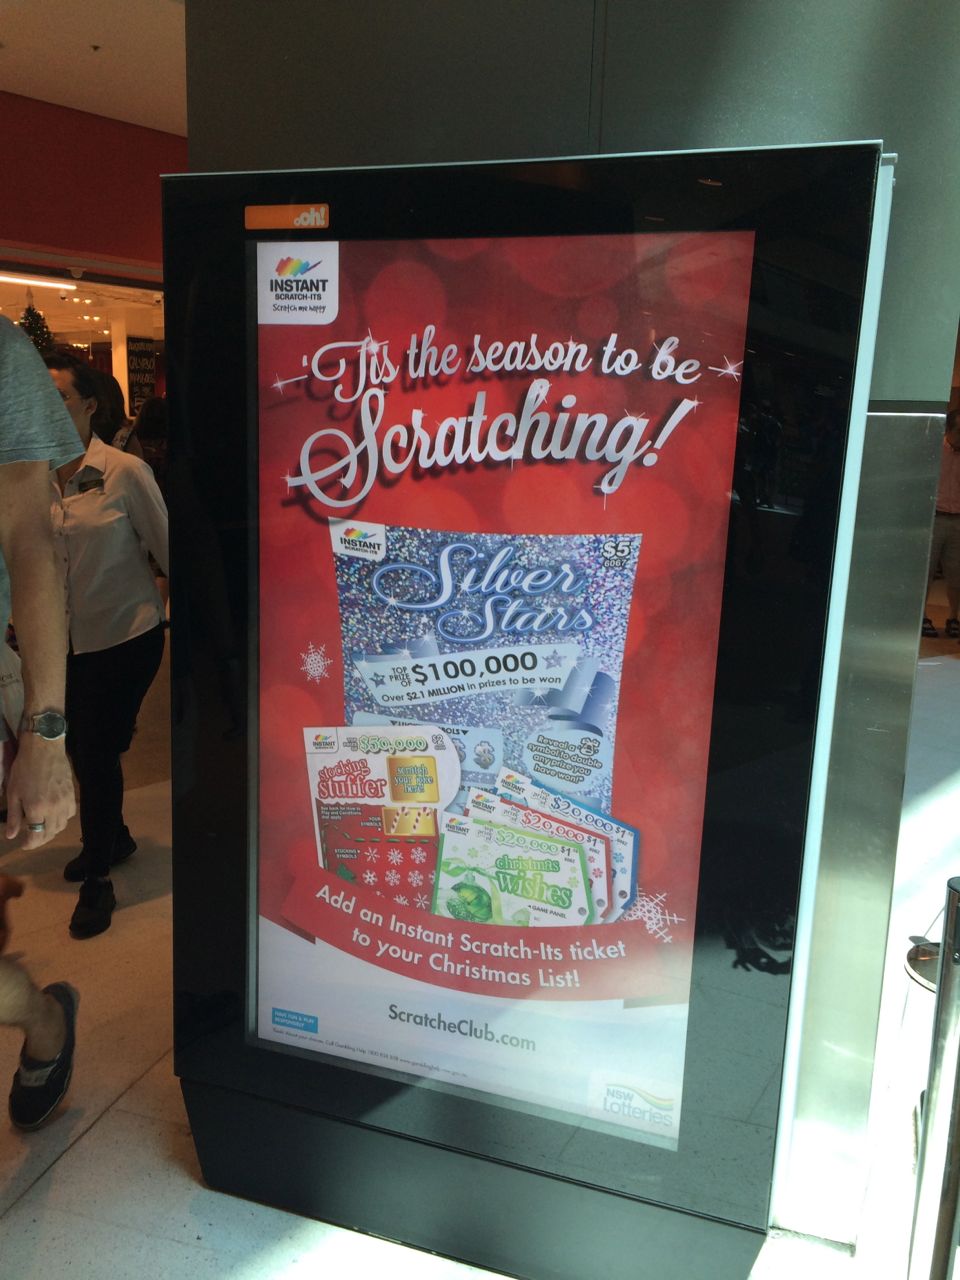 At Westfield Bondi shopping mall earlier this week I noticed this sign promoting instant scratch tickets outside of Coles. While there was no mention of retailers selling scratch tickets, the poster promoted scratcheclub.com.au. This is a Tatts owned website where scratch ticket customers can enter second chance draws, participate in a birthday draw, play puzzles and engage in other scratch ticket related activity.