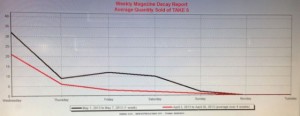
 This graph shows how the Take 5 campaign cash promotion worked for from Wednesday through to Sunday. The black line shows sales for the week and the red is the average achieved for the previous three weeks. The graph shows that for the first five days sales were ahead of average. I am particularly interested in the sales growth achieved Friday and Saturday.
While we did promote this issue more than usual, I am certain that it is the cash promotion that drove sales.
We get hit with different promotions every week and it is hard to give each time in the spotlight. This is one reason I took the time to see the sales impact of this promotion. I plan to do it for more promotions, to build a better knowledge based about the promotions that work and those that don’t work.
I’d encourage other newsagents to do the same. Data provides us the best guidance for what we do in our businesses.