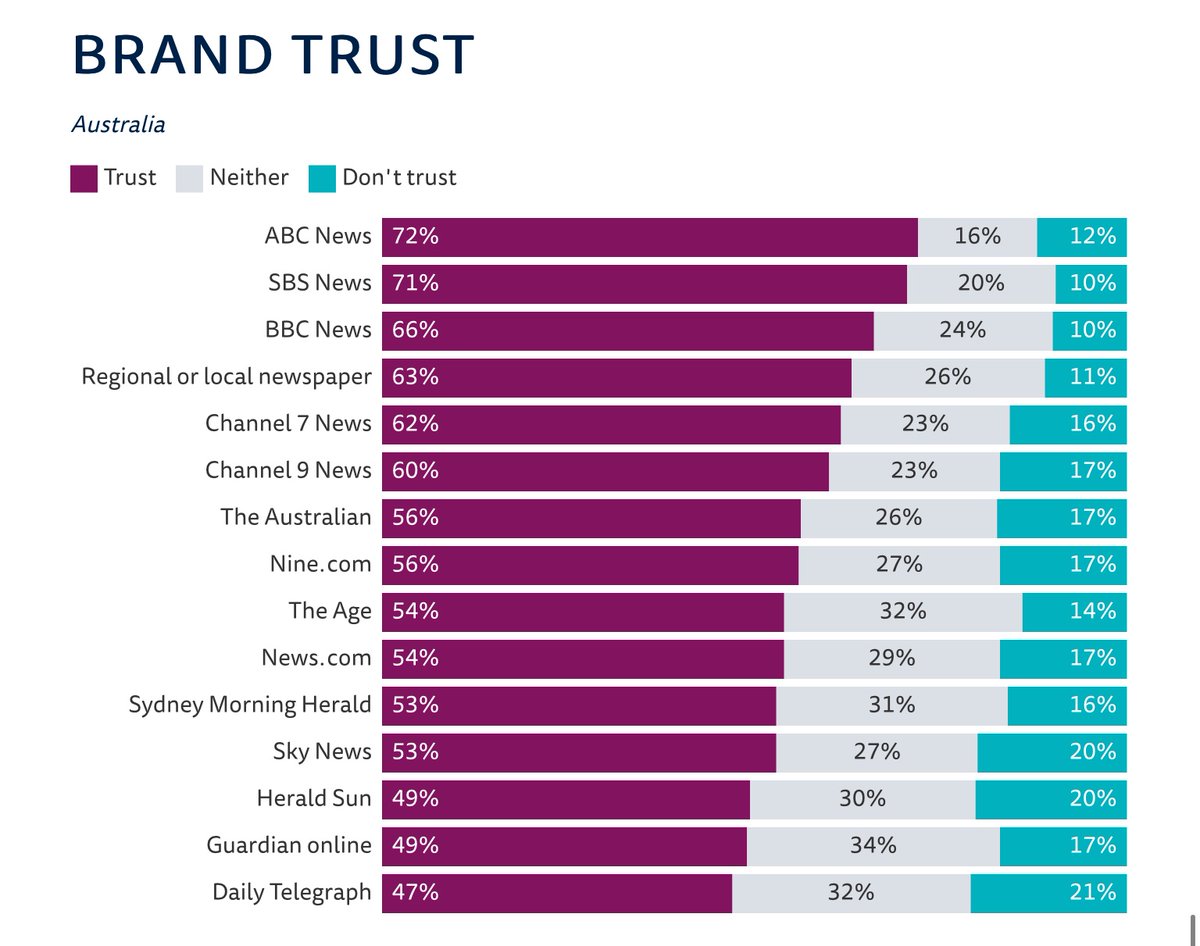
Be interesting to know the sample size used. Not a lot of difference really in the teal coloured “don’t trust” figure, between top and bottom. Seems a growing amount of people in the “neither” category, is that the “couldn’t care less” category? The fact that the oz is technically the most trusted newspaper surprises as I would think, based on circulation or readership, most people wouldn’t even know that this news outlet existed.
Sample size for Australia: 2,131. Statistically suitable. Australia’s sample size the second biggest in this International research.
They noted: Data are from more urban areas, rather than a fully nationally representative sample. These will tend to represent richer
and more connected users which should be taken into consideration when interpreting results.
0 likes
Peter
In other words a “diverse” demographic of 2000 people from the inner city.
However you want to spin it Peter. The study is referred to widely here and overseas, including by news outlets such as News Corp. Given the wide reporting of the results and the 112 page report, it seems respected. I have no connection with the anyone involved in it. I do think the results are interesting.
0 likes
Peter
That’s interesting, I hadn’t even thought of you having a connection with anyone involved in it. That could be awkward. I’m just commenting on the limited and biased nature of the sample size. Too many times we are presented with polls and statistics that have been compiled this way. Think our recent election and the US election. It’s the product of like minded people polling like minded people.
Sure Peter. If you took the time to read the full report you’d realise why the results are respected by a diverse group. This, from page 6 may help you:
Methodology
This study has been commissioned by the Reuters Institute
for the Study of Journalism to understand how news is being
consumed in a range of countries. Research was conducted by
YouGov using an online questionnaire at the end of January/
beginning of February 2020.
• Samples in each country were assembled using nationally
representative quotas for age, gender, region, and education.
The data were also weighted to targets based on census/
industry accepted data.
• As this survey deals with news consumption, we !ltered out
anyone who said that they had not consumed any news in the
past month, in order to ensure that irrelevant responses didn’t
adversely a%ect data quality. This category averaged around 3%.
• We should note that online samples will tend to under-represent
the consumption habits of people who are not online (typically
older, less a&uent, and with limited formal education). In this sense
it is better to think of results as representative of online populations
who use news at least once a month. In a country like Norway this
is almost everyone (98%) but in Mexico it is only two-thirds (66%)
and in South Africa just over half (55%). Our sample in Kenya only
includes those aged 18-54 due to di#culties in reaching older
people online. These di%erences mean we need to be cautious
when comparing results between countries. We have marked
countries with lower internet penetration or less representative
online samples with an asterisk (*) in the table at the end of
this section and have been careful in the report not to directly
compare these countries on issues where we know that the sample
di%erence would make results invalid (eg paying for news).
• It is important to note that some of our survey-based results
will not match industry data, which are o$en based on di%erent
methodologies, such as web-tracking. The accuracy of these
approaches can be high, but they are subject to di%erent
limitations, meaning that data can also be partial or incomplete.
• It is also important to note that online surveys rely on recall,
which is o$en imperfect or subject to biases. We have tried
to mitigate these risks through careful questionnaire design
and testing. On the other hand, surveys can be a good way of
capturing fragmented media consumption across platforms
(eg social media, messaging, apps, and websites), and tracking
activities and changes over time.
• We conducted two additional surveys this year. The !rst was
a detailed study of paying for online news where we surveyed
around 4,000 respondents in the United States and the United
Kingdom and around 2,000 respondents in Norway. Polling
was conducted by YouGov in February 2020 using a similar
methodology as for the main survey. In April we conducted
an additional survey with the Misinformation, Science and
Media project run by the Reuters Institute in collaboration
with the Oxford Internet Institute and support from the
Oxford Martin School to understand the impact of the novel
coronavirus on media consumption in six countries (UK, USA,
Germany, Spain, Argentina, and South Korea). Samples sizes
were approximately 2,000 in the UK and Germany, and 1,000
elsewhere. We have indicated occasions where data come
from these additional surveys next to the appropriate chart.
Where we compare the results from this survey to the DNR,
we have removed those that use news less than once a month
to make the data more directly comparable. For more details
on the methodology for this survey, see the standalone report
(Nielsen et al. 2020). Open questions were used in our surveys
and some user comments have been drawn from these and are
used in the text.
• A fuller description of the methodology, panel partners, and
a discussion of non-probability sampling techniques can
be found on our website along with the full questionnaire
(digitalnewsreport.org).
0 likes
Peter
Wow, you’re sensitive Mark. I stand by what I’ve said on this matter, based on the note you gave in comment 2
They noted: Data are from more urban areas, rather than a fully nationally representative sample. These will tend to represent richer
and more connected users which should be taken into consideration when interpreting results.
Mark, a very interesting comparison.
i applied my own reading viewing habits as that’s what comparisons are about and……
.V. News -I watch Channel 7. 6-6.30 for everyday contact local stuff bit Daily Tele news etc.
2. Switch to Channel 3 SBS News local and International (used to be channel 2) until 7.30. ten Leigh Sales channel 2 howver not now got sick of the political bias. I just want news i am old enough to sort the rest out. Read -subscription and have delivered hard copy Aust. SMH.ST SH.
Purchase daily Mon to Sat at newsagent AFR.
Read selective Blogs and business plus entertainment reviews.
Plus read mainly non fiction but some very good novels.
Watch SBS on Demand. curently The Bureau French sub titled espionage thriler.
So pretty much across the board.
So I found the survey interseting and once I applied my stats I confirmed it’s authenticity of pecking order- according to Hoyle of course.
0 likes
PJ
Local and regional newspapers listed as the most trusted and least distrusted of print media. As of next month most will be gone. Admittedly if a higher amount of older consumers were included the Newscorp brands probably wouldn’t do as bad. The result to look at is the don’t trust percentage.
Be interesting to know the sample size used. Not a lot of difference really in the teal coloured “don’t trust” figure, between top and bottom. Seems a growing amount of people in the “neither” category, is that the “couldn’t care less” category? The fact that the oz is technically the most trusted newspaper surprises as I would think, based on circulation or readership, most people wouldn’t even know that this news outlet existed.
Sample size for Australia: 2,131. Statistically suitable. Australia’s sample size the second biggest in this International research.
They noted: Data are from more urban areas, rather than a fully nationally representative sample. These will tend to represent richer
and more connected users which should be taken into consideration when interpreting results.
In other words a “diverse” demographic of 2000 people from the inner city.
However you want to spin it Peter. The study is referred to widely here and overseas, including by news outlets such as News Corp. Given the wide reporting of the results and the 112 page report, it seems respected. I have no connection with the anyone involved in it. I do think the results are interesting.
That’s interesting, I hadn’t even thought of you having a connection with anyone involved in it. That could be awkward. I’m just commenting on the limited and biased nature of the sample size. Too many times we are presented with polls and statistics that have been compiled this way. Think our recent election and the US election. It’s the product of like minded people polling like minded people.
Sure Peter. If you took the time to read the full report you’d realise why the results are respected by a diverse group. This, from page 6 may help you:
Methodology
This study has been commissioned by the Reuters Institute
for the Study of Journalism to understand how news is being
consumed in a range of countries. Research was conducted by
YouGov using an online questionnaire at the end of January/
beginning of February 2020.
• Samples in each country were assembled using nationally
representative quotas for age, gender, region, and education.
The data were also weighted to targets based on census/
industry accepted data.
• As this survey deals with news consumption, we !ltered out
anyone who said that they had not consumed any news in the
past month, in order to ensure that irrelevant responses didn’t
adversely a%ect data quality. This category averaged around 3%.
• We should note that online samples will tend to under-represent
the consumption habits of people who are not online (typically
older, less a&uent, and with limited formal education). In this sense
it is better to think of results as representative of online populations
who use news at least once a month. In a country like Norway this
is almost everyone (98%) but in Mexico it is only two-thirds (66%)
and in South Africa just over half (55%). Our sample in Kenya only
includes those aged 18-54 due to di#culties in reaching older
people online. These di%erences mean we need to be cautious
when comparing results between countries. We have marked
countries with lower internet penetration or less representative
online samples with an asterisk (*) in the table at the end of
this section and have been careful in the report not to directly
compare these countries on issues where we know that the sample
di%erence would make results invalid (eg paying for news).
• It is important to note that some of our survey-based results
will not match industry data, which are o$en based on di%erent
methodologies, such as web-tracking. The accuracy of these
approaches can be high, but they are subject to di%erent
limitations, meaning that data can also be partial or incomplete.
• It is also important to note that online surveys rely on recall,
which is o$en imperfect or subject to biases. We have tried
to mitigate these risks through careful questionnaire design
and testing. On the other hand, surveys can be a good way of
capturing fragmented media consumption across platforms
(eg social media, messaging, apps, and websites), and tracking
activities and changes over time.
• We conducted two additional surveys this year. The !rst was
a detailed study of paying for online news where we surveyed
around 4,000 respondents in the United States and the United
Kingdom and around 2,000 respondents in Norway. Polling
was conducted by YouGov in February 2020 using a similar
methodology as for the main survey. In April we conducted
an additional survey with the Misinformation, Science and
Media project run by the Reuters Institute in collaboration
with the Oxford Internet Institute and support from the
Oxford Martin School to understand the impact of the novel
coronavirus on media consumption in six countries (UK, USA,
Germany, Spain, Argentina, and South Korea). Samples sizes
were approximately 2,000 in the UK and Germany, and 1,000
elsewhere. We have indicated occasions where data come
from these additional surveys next to the appropriate chart.
Where we compare the results from this survey to the DNR,
we have removed those that use news less than once a month
to make the data more directly comparable. For more details
on the methodology for this survey, see the standalone report
(Nielsen et al. 2020). Open questions were used in our surveys
and some user comments have been drawn from these and are
used in the text.
• A fuller description of the methodology, panel partners, and
a discussion of non-probability sampling techniques can
be found on our website along with the full questionnaire
(digitalnewsreport.org).
Wow, you’re sensitive Mark. I stand by what I’ve said on this matter, based on the note you gave in comment 2
They noted: Data are from more urban areas, rather than a fully nationally representative sample. These will tend to represent richer
and more connected users which should be taken into consideration when interpreting results.
Pretty self explanatory actually
Mark, a very interesting comparison.
i applied my own reading viewing habits as that’s what comparisons are about and……
.V. News -I watch Channel 7. 6-6.30 for everyday contact local stuff bit Daily Tele news etc.
2. Switch to Channel 3 SBS News local and International (used to be channel 2) until 7.30. ten Leigh Sales channel 2 howver not now got sick of the political bias. I just want news i am old enough to sort the rest out. Read -subscription and have delivered hard copy Aust. SMH.ST SH.
Purchase daily Mon to Sat at newsagent AFR.
Read selective Blogs and business plus entertainment reviews.
Plus read mainly non fiction but some very good novels.
Watch SBS on Demand. curently The Bureau French sub titled espionage thriler.
So pretty much across the board.
So I found the survey interseting and once I applied my stats I confirmed it’s authenticity of pecking order- according to Hoyle of course.
Local and regional newspapers listed as the most trusted and least distrusted of print media. As of next month most will be gone. Admittedly if a higher amount of older consumers were included the Newscorp brands probably wouldn’t do as bad. The result to look at is the don’t trust percentage.