Thank you to the 119 newsagents trading under a variety of shingles and in a variety of settings (rural, regional and suburban high street) who provided sales data for this benchmark study. The only connection is that they use newsagency software from my POS software company. Their transparency will help many in our channel.
Plenty of good news in retail newsagency benchmark study comparing 2022 to 2019.
Many newsagents had an excellent 2022 compared to 2019, the majority who participated in this benchmark study in fact.
Common among those who did well is active engagement in non newsagency traditional product lines, active promotion of the business outside the business, and focussing on three key metrics: basket value, margin and the cost base of the business.
Common among the businesses that did not report as good results is their focus on traditional newsagency operation: lotteries, papers and magazines more so than other product categories.
What is particularly interesting is the results for businesses that transitioned from traditional in 2019 to innovate in 2022. In those cases, the results are extraordinary. In one million dollar business the revenue was almost the same but business GP% moves from 29% to 34%, which is an extra $50,000 in gross profit. In another business they added $120,000 to their $590,000 revenue with the added revenue for items achieving more than 50% GP.
This is the story that stands out when comparing 2022 to 2019, transition. Transition from relying on agency revenue, from relying on commission, to relying of good margin from sought-after products through which the business can attract new shoppers, non newsagency traditional shoppers. A highlight of the transition as evidenced in the dataset is that size and location do not matter. Okay, location in terms of shopping centre matters as it’s not proving to be a winner for our channel, but outside of shopping centres – city or country, large or small – success is equally attainable.
After comparing data from the businesses in the benchmark dataset here are the averages for business performance measurement points and categories, comparing 2022 with 2019:
- Revenue: Up 9.5%.
- Sales transaction count: Down 1%.
- Basket value: Up 9%.
- Items per basket: Up 7%.
- Average item value: Up 7%.
- Greeting card revenue: Up 7%.
- Magazines unit sales: Down 1%. This is an unfair measure because of the big difference between businesses, bigger than for any other category.
- Toy (incl. plush) revenue: Up 22%. 25% of those in the study have this category
- Gift revenue: Up 35%.
- Book revenue: Up 15%. 12% of those in the study have this category.
- Fashion: 70%. 20% of those in the study have this category.
- Stationery revenue: Up 3%.
Since the above results are averages, there are some considerably below and some considerably above.
There is also interesting data within departments, like stationery and magazines:
- In magazines, weeklies experienced the biggest decline again. Special interest titles are the winners, often delivering double-digit growth.
- In stationery, everyday is patchy but special interest, fringe, stationery is doing very well.
- Newsagents with a unique add-on category, such as firearms, music or pet food, tend to see these doing well.
I have a note about traditional categories: lotteries, papers and magazines. They are important, but they should no longer define your business. Make what you can from them, support them well, but do 9other things to attract new shoppers who will purchase better margin products from you. And on magazines, if you focus on special interest titles and promote them outside your shop, you could do very well.
Evidence.
Common feedback I get from these benchmark studies is can I see the report for the best shop so I can learn. I can’t do that. But I can share snippets. Here are some category specific snippets from different businesses. The results speak for themselves.
Cards.

Gifts.
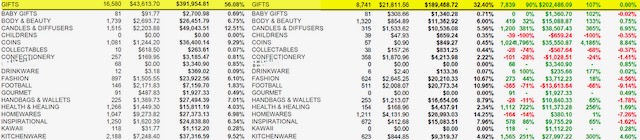

Toys.

Clothing.

Magazines.

I am concerned about my numbers, what can I do?
If you want better results it is up to you to act.
There is no one size fits all solution, anyone who says there is is wrong.
The first step is to understand where you are at, from the data evidence in your business. next, you need a plan. Then, you execute with clarity and commitment, and draw on the support of others who have done this.
I own newsXpress, a marketing group supporting newsagents. newsXpress helps with this. If it interests you, please email help@newsxpress.com.au or call Michael Elvey on 0400 331 055 – he’s not a sales person, he’s part of the team encouraging success.
Mark Fletcher
M | 0418 321 338
https://www.linkedin.com/in/mark-fletcher-tower/
This is interesting and helpful data Mark. Clearly some newsagents are doing very well in gifts. I am curious, however, about newspaper sales data.
Hi Peter, I didn’t include newspapers because the numbers varied more than for any other category. While almost all were down, the decline ranged from 12% to more than 50% – looking at unit sales rather than revenue.
While newspapers benefited from a bump early in the pandemic, by late 2021 the trend had returned to the steady decline.
I have looked at January 2023 data for a smaller group of newsagencies and the newspaper decline there, for over the counter purchases, is north of 10%.
The newspaper trend is evidence in the latest News Corp. published results, too.